SQL/Tableau: AFDB Market Trends with Viz. Part 2

The next visualization request is to be able to view the differences in the initial value of each indicator, and the final value of each indicator. This will be completed in SQL.
Requirements:
- Extract month and year from date
- Average values based on indicator, year, and month
- Filter by the first month in the data provided
- Follow the above steps, except filter by last month
- Join those tables together
SELECT
	--3 final output
	-- indicator | initial date | initial average | ending date | ending average
	initial_values.indicatorname,
	make_date(CAST(initial_year AS INT), CAST(initial_month AS INT), 1) AS initital_date,
	initial_average,
	make_date(CAST(ending_year AS INT), CAST(ending_month AS INT), 1) AS ending_date,
	ending_average
FROM (
	/*1  Create a month/year format and aggregate
	Averagre value per indicator per month/year
	Only include first month using HAVING clause*/
	SELECT
		indicatorname,
		EXTRACT('Year' FROM date) AS initial_year,
		EXTRACT('Month' FROM date) AS initial_month,
		AVG(value) AS initial_average
	FROM
		afdbmarkettrends2015
	GROUP BY
		indicatorname, initial_year, initial_month
	HAVING
		EXTRACT('Year' FROM date) = 2011
		AND
		EXTRACT('Month' FROM date) = 1
	ORDER BY
		indicatorname, initial_year, initial_month)
	AS initial_values
JOIN(
	/*2  Same as first except
	Only include last month using HAVING clause*/
	SELECT
		indicatorname,
		EXTRACT('Year' FROM date) AS ending_year,
		EXTRACT('Month' FROM date) AS ending_month,
		AVG(value) AS ending_average
	FROM
		afdbmarkettrends2015
	GROUP BY
		indicatorname, ending_year, ending_month
	HAVING
		EXTRACT('Year' FROM date) = 2015
		AND
		EXTRACT('Month' FROM date) = 7
	ORDER BY
		indicatorname, ending_year, ending_month)
	AS ending_values
ON
	initial_values.indicatorname = ending_values.indicatorname
OUTPUT:
| indicatorname | initital_date | initial_average | ending_date | ending_average |
| Baltic Dry Index | 2011-01-01 | 1401.4 | 2011-01-01 | 954.9 |
| CFA zone Countries CFA Franc | 2011-01-01 | 492.8661 | 2011-01-01 | 596.559305 |
| Cocoa (USD/tonne) | 2011-01-01 | 3164.863 | 2011-01-01 | 3332.6425 |
| Coffee Brazilian Naturals (US cents/tonne) | 2011-01-01 | 209.2631578947 | 2011-01-01 | 111.9342105263 |
| … | … | … | … | … |
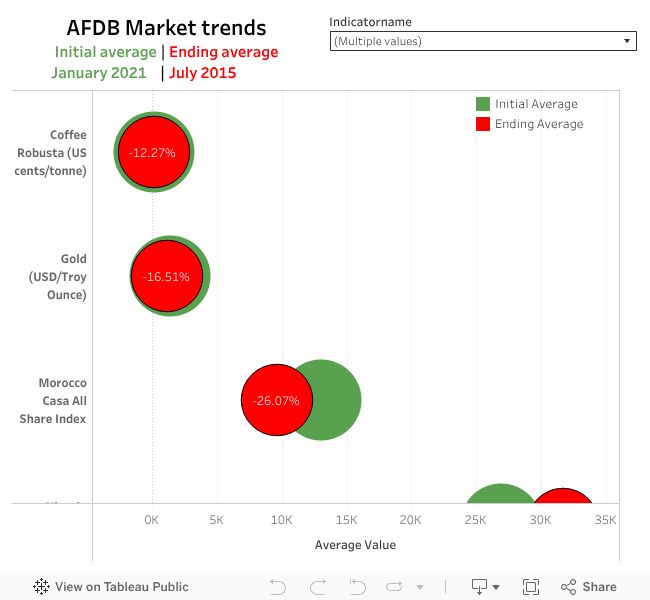
Then we will use this data in Tableau for the visualization.
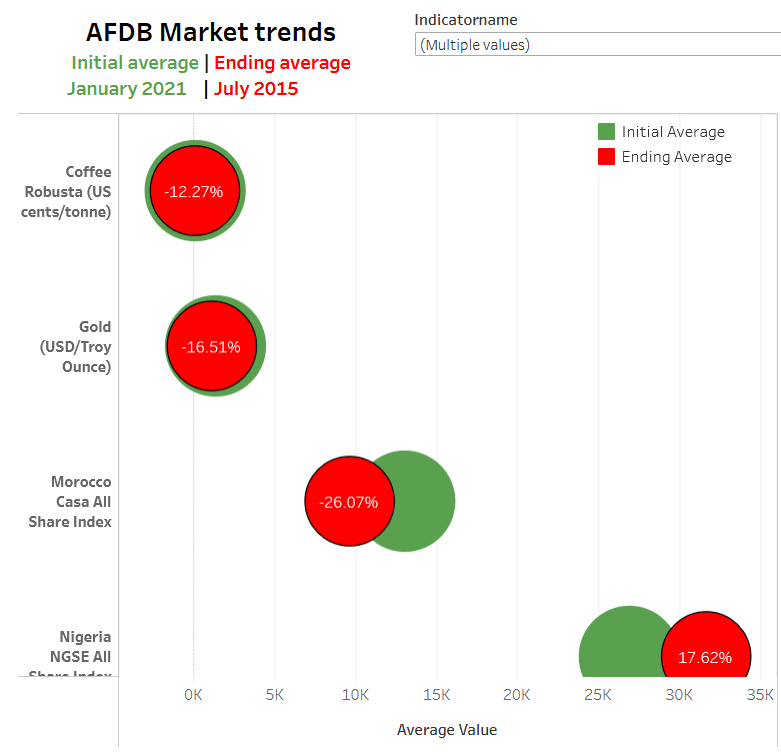
The following dashboard allows the user to select which indicator(s) they would like to view, and shows the initial and final averages in an easy to understand chart.