Superset - Agriculture Crop Production Visualization

I'll be using superset to visualize the agricultural crop production dataset that I used in my previous R post. I'll make a dashboard that can compare land use efficiency between 1961 and 2018.
I will do an overview of the work done to create the dashboard, If you would prefer you can Jump to the dashboard link here. **Update my self hosted superset container is no longer running. I have included videos of the dashboard in the post instead of embedding directly to the server.
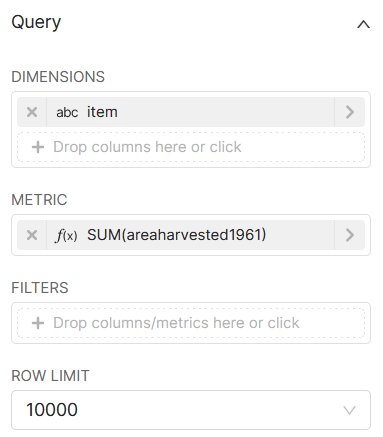
Superset dashboards are made of charts and layout elements. I started by making the charts for each element. I would need a chart for 'Tonnes Produced in 1961', 'Acres used in 1961', 'Tonnes Produced in 1961', and 'Acres used in 2018'. In addition to these charts, I want to include a visualization that would compare the individual crop's land use productivity. Also, a large metric that shows the percentage increase of all crops selected.

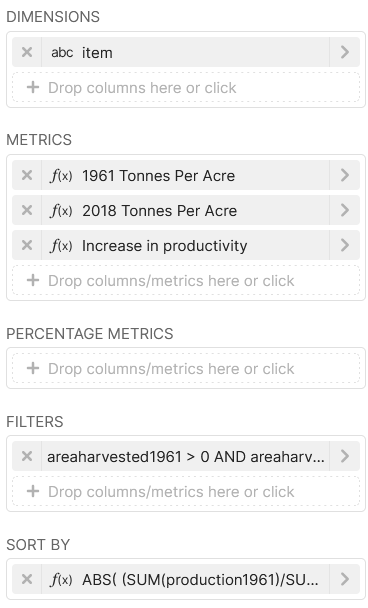
The Tonnes Per Acre chart would be a bit more involved as it would require a bit of custom SQL, and a few filters.

SQL for the metrics, filters, and sorting are below (full SQL is not required for these settings, as Superset takes care of much of it):
--Metrics
--1961 Tonnes Per Acre
SUM(production1961) / SUM(areaharvested1961)

--2018 Tonnes Per Acre
SUM(production2018) / SUM(areaharvested2018)

--Increase in productivity
ABS(
  (SUM(production1961)/SUM(areaharvested1961)) -
  (SUM(production2018)/SUM(areaharvested2018)))
  /(SUM(production1961)/SUM(areaharvested1961))

 /*Filters
For the filters I wanted to do two things, I needed to include items that had values in 1961 and 2018.  By filtering where the production and area harvested are greater than 0 helped with this.  It also had the effect of making sure there was no division by zero errors */

--Sorting
ABS(
 (SUM(production1961)/SUM(areaharvested1961)) -
 (SUM(production2018)/SUM(areaharvested2018)))
 /(SUM(production1961)/SUM(areaharvested1961))
--Making the sort order descending is done through the User Interface.
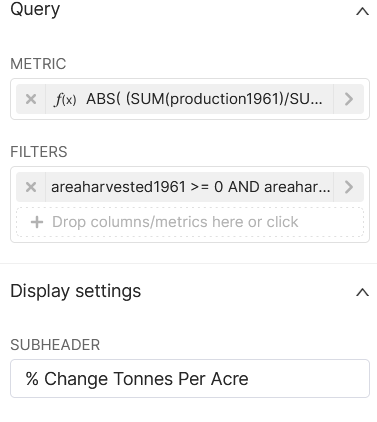
This sorts out the tables and charts, the last thing I want to include on my dashboard is a large number that indicates the total efficiency increase.

This is all of the elements of the dashboard save for the filters. So let's take a look at the filters we will use. A filter for the Continent, by Country, by tonnes produced, and to look at specific crops.

With the filters and dashboard's elements complete the dashboard is ready to explore whatever of detail the user needs.
Superset dashboard
I strongly recommend viewing the dashboard on a larger screen than a mobile device. You can view the dashboard from the Supererset instance by clicking this link.