Python EDA - London Bus Safety Part 2/2

- How many unique fields are there for each variable?
- How much nullity is there for each variable?
- Create a new variable to describe if the person was taken to hospital.
- Do any operators have a higher incidence of overall incidents?
- Do any operators have a higher incident of hospitalizations?*
- Compare the 'Slip Trip Fall' count with different operators. Order them by operators with most 'Slip Trip Fall's to least. Which operator has the most of these incidents?*
*We have already explored questions 1 through 4 in the previous post, we will continue with the final 2 tasks of this analysis.
Data preview:
| Year | Date Of Incident | Route | Operator | Group Name | Bus Garage | Borough | Injury Result Description | Incident Event Type | Victim Category | Victims Sex | Victims Age | |
|---|---|---|---|---|---|---|---|---|---|---|---|---|
| 0 | 2015 | 1/1/2015 | 1 | London General | Go-Ahead | Garage Not Available | Southwark | Injuries treated on scene | Onboard Injuries | Passenger | Male | Child |
| 1 | 2015 | 1/1/2015 | 4 | Metroline | Metroline | Garage Not Available | Islington | Injuries treated on scene | Onboard Injuries | Passenger | Male | Unknown |
| 2 | 2015 | 1/1/2015 | 5 | East London | Stagecoach | Garage Not Available | Havering | Taken to Hospital – Reported Serious Injury or... | Onboard Injuries | Passenger | Male | Elderly |
| 3 | 2015 | 1/1/2015 | 5 | East London | Stagecoach | Garage Not Available | None London Borough | Taken to Hospital – Reported Serious Injury or... | Onboard Injuries | Passenger | Male | Elderly |
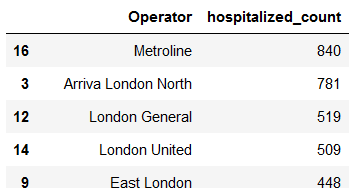
5. Do any operators have a higher incident of hospitalizations?
Fairly straightforward because we have already created a field for hospitalized, let's aggregate that, and use Seaborn to plot it.
#Aggregate the count of hospitilizations
operator_hospitalizations = df.groupby(['Operator'], as_index=False).agg(hospitalized_count = ('Hospitalized', 'sum'))

#Sort values by hospitalizations descending
operator_hospitalizations = operator_hospitalizations.sort_values(by=['hospitalized_count'], ascending=False)

#Display
operator_hospitalizations
OUTPUT:
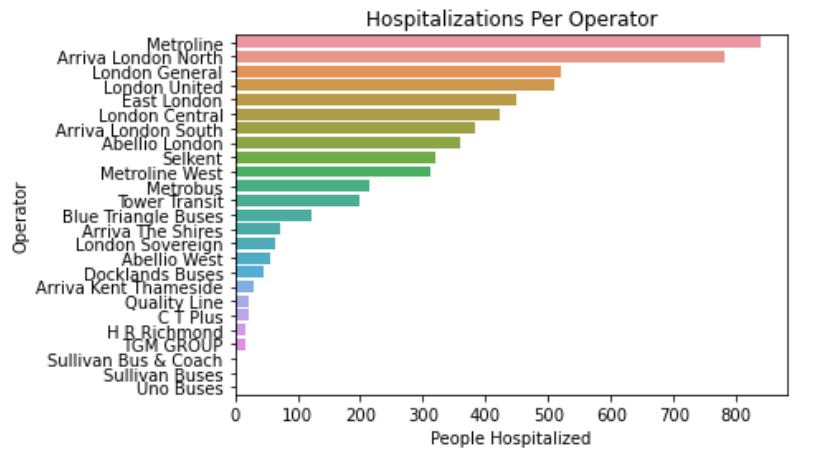
Then we will use matplotlib and seaborn to visualize the data.
#Add a visualization

import seaborn as sns
import matplotlib.pyplot as plt

operator_hospitalizations_chart = sns.barplot(
    x= operator_hospitalizations['hospitalized_count'],
    y = operator_hospitalizations['Operator']
    )

operator_hospitalizations_chart.set_title('Hospitalizations Per Operator')
operator_hospitalizations_chart.set_xlabel('People Hospitalized')

plt.show()
OUTPUT:
And now for the final task
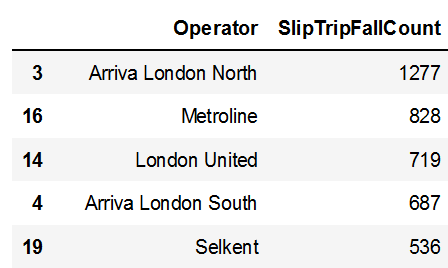
6. Compare the slip trip fall count (in incident event type) with different operators. Order them by operators with most slip trip falls to least.
#search for Slip Trip Fall in 'Incident Event Type'

df['SlipTripFall'] = df['Incident Event Type'].str.contains('Slip Trip Fall')
#Confirm that the string is found (if so there will be two unique values,

operator_tripslipfall = df.groupby(['Operator'], as_index=False).agg(SlipTripFallCount = ('SlipTripFall', 'sum'))

operator_tripslipfall = operator_tripslipfall.sort_values(by=['SlipTripFallCount'], ascending=False)

operator_tripslipfall
OUTPUT:
Then we will make a visualization of the data using matplotlib and seaborn
import seaborn as sns

sns.barplot(
    x= operator_tripslipfall['SlipTripFallCount'],
    y = operator_tripslipfall['Operator']
    )


#Add a visualization

import seaborn as sns
import matplotlib.pyplot as plt

operator_tripslipfall_chart = sns.barplot(
    x= operator_tripslipfall['SlipTripFallCount'],
    y = operator_tripslipfall['Operator']
    )

operator_tripslipfall_chart.set_title('Slip/Trip/Fall Count Per Operator')
operator_tripslipfall_chart.set_xlabel('People who Slipped/Tripped/Fell')

plt.show()


###ANSWER THE QUESTION

print('The Operator with the most Slip/Trip/Fall incidents is:\n\n'
      + BOLD + operator_tripslipfall['Operator'].iloc[0] + END)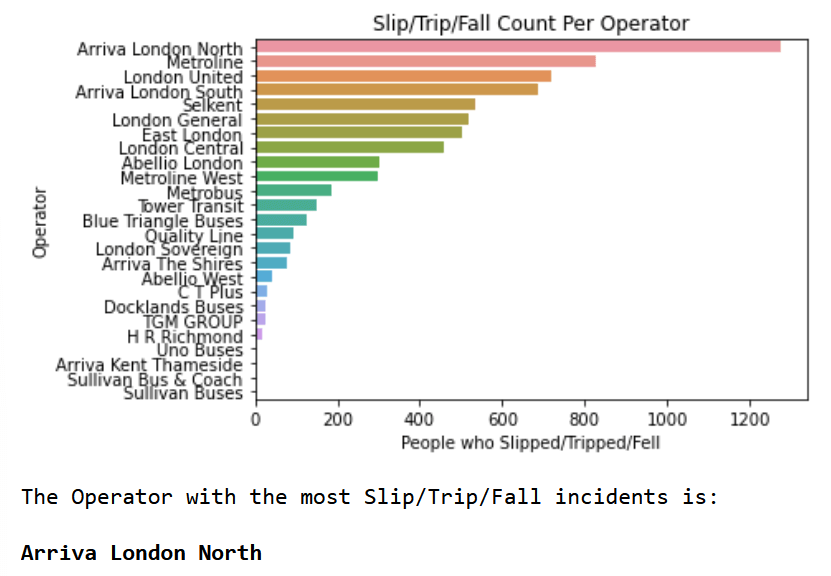
And that is the end of our Python Exploratory Data Analysis.