Python EDA - London Bus Safety Part 1/2

Transport for London provided their data on bus safety. This data will be explored using Python.
We will use a Jupyter notebook using python 3. We do our library imports, import the data, and preview:
import pandas as pd
import numpy as np

#For formatting output
BOLD = '\033[1m'
END = '\033[0m'

df = pd.read_csv("TFL Bus Safety.csv",encoding='cp1252')
df.head()
OUTPUT:
| Year | Date Of Incident | Route | Operator | Group Name | Bus Garage | Borough | Injury Result Description | Incident Event Type | Victim Category | Victims Sex | Victims Age | |
|---|---|---|---|---|---|---|---|---|---|---|---|---|
| 0 | 2015 | 1/1/2015 | 1 | London General | Go-Ahead | Garage Not Available | Southwark | Injuries treated on scene | Onboard Injuries | Passenger | Male | Child |
| 1 | 2015 | 1/1/2015 | 4 | Metroline | Metroline | Garage Not Available | Islington | Injuries treated on scene | Onboard Injuries | Passenger | Male | Unknown |
| 2 | 2015 | 1/1/2015 | 5 | East London | Stagecoach | Garage Not Available | Havering | Taken to Hospital – Reported Serious Injury or... | Onboard Injuries | Passenger | Male | Elderly |
| 3 | 2015 | 1/1/2015 | 5 | East London | Stagecoach | Garage Not Available | None London Borough | Taken to Hospital – Reported Serious Injury or... | Onboard Injuries | Passenger | Male | Elderly |
We will be doing 6 tasks to explore this data:
- How many unique fields are there for each variable?
- How much nullity is there for each variable?
- Create a new variable to describe if the person was taken to hospital.
- Do any operators have a higher incidence of overall incidents?
- Do any operators have a higher incident of hospitalizations?*
- Compare the 'Slip Trip Fall' count with different operators. Order them by operators with most 'Slip Trip Fall's to least. Which operator has the most of these incidents?*
*Items 5 and 6 will be finished in the next post.
1a. How many unique fields are there for each variable?
This is very straightforward as pandas has the nunique() method.
df.nunique()OUTPUT:
Year                           4
Date Of Incident              45
Route                        612
Operator                      25
Group Name                    14
Bus Garage                    84
Borough                       35
Injury Result Description      4
Incident Event Type           10
Victim Category               17
Victims Sex                    3
Victims Age                    5
dtype: int64
1b. London does not have 35 Boroughs, I know this because I googled it...
so I put a list of London Boroughs in a dataframe and compared this to the 'list' of Boroughs in this dataset.
#copy list of boroughs
dfboroughs = pd.read_csv("londonboroughlist.csv")

#remove whitespace (the copying of boroughs caused a trailing whitespace)
dfboroughs['borough'] = dfboroughs['borough'].str.strip()

#convert the dataframe to a list
dfboroughs = dfboroughs['borough'].to_list()

#List of valuses are in the dataframe['Borough'] but are not in the borough list.
nonboroughs = df['Borough'][~df['Borough'].isin(dfboroughs)].unique()


#Show what boroughs are in the dataframe that are not in the borough list.
print('Dataframe contains these non-borough fields as boroughs:\n')

for i in nonboroughs:
    print("'" + i + "''")
OUTPUT:
Dataframe contains these non-borough fields as boroughs:
'None London Borough''
'City of London''
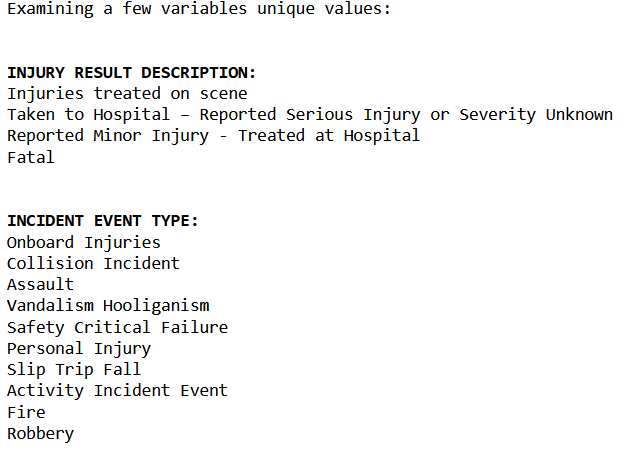
'Not specified''1c. Examine unique values on a subset of values, then on all values
With this we can understand what may be categorical. We will also need to examine how this dataset reports nulls, so the exhaustive list of values will be helpful.
examine_unique_list = ['Injury Result Description', 'Incident Event Type', 'Victim Category','Victims Sex', 'Victims Age']

print('Examining a few variables unique values:\n\n')

for i in examine_unique_list:
    print(BOLD + i.upper() + ':' + END)
    print(*df[i].unique(), sep = '\n')
    print('\n')
OUTPUT:
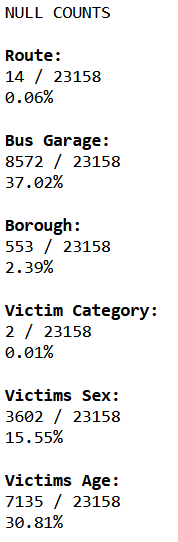
2a. How much null is there in each variable?
'''Using the output above, find out how null is reported on each column, we will
use a dictionary to map the column with how null is reported.'''

column_null_dictionary = {
    'Route': '(blank)',
    'Bus Garage': 'Garage Not Available',
    'Borough': 'Not specified',
    'Victim Category': 'Insufficient Data',
    'Victims Sex': 'Unknown',
    'Victims Age': 'Unknown'
}


print("NULL COUNTS\n")

#Calculate row count of dataframe this is used for percent calculations
row_count = df.shape[0]


'''Iterate through the dictonary and replace values with NaN
and report nulls as we go'''

for x, y in column_null_dictionary.items():
    #Replace the column values with null where appropriate
    df[x].replace(y, np.nan, inplace=True)

    #Set null_count
    null_count = df[x].isna().sum()
    null_count_percent = round(((null_count / row_count)*100),2)

    #Count and report the nulls
    print(BOLD + x + ':' + END + '\n' + str(null_count) + ' / ' + str(row_count))

    #Report percent
    print(str(null_count_percent)  + '%' + '\n')
OUTPUT:
Continuing this we will just run a report on nulls:
#Report on all variables as a 'sanity check'
df.isna().sum()
OUTPUT:
Year                            0
Date Of Incident                0
Route                          14
Operator                        0
Group Name                      0
Bus Garage                   8572
Borough                       553
Injury Result Description       0
Incident Event Type             0
Victim Category                 2
Victims Sex                  3602
Victims Age                  7135
dtype: int64
2b Visualize nullity
I will use the missingno library to output a nullity matrix.
import missingno as msno

#only report missing numbers on data with missing values
msno.matrix(df[list(column_null_dictionary.keys())]) 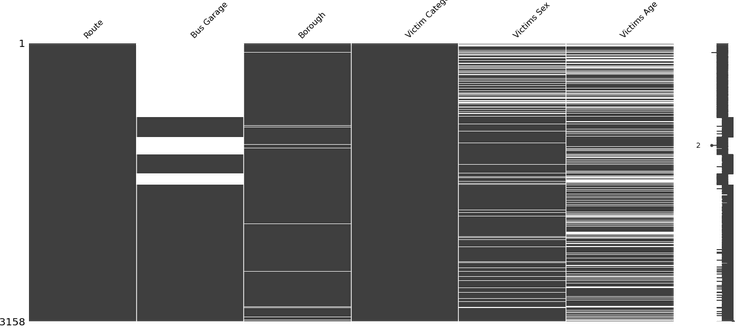
3 Create a new variable to describe if the person was taken to hospital.
#If the Injury Result Description has the string 'Hospital' create bool T/F
df['Hospitalized'] = df['Injury Result Description'].str.contains('Hospital')

#Convert bool T/F into yes/no responses
df['HospitalizedYN'] = df['Hospitalized'].replace({
    True: "Yes",
    False: "No"
})

'''A column with true and false values is kept for future aggregations,
this is with the hindsight of proofreading, originally I converted it back
to boolean to do the aggregations'''

print('View of the new variables\n')
print(df['HospitalizedYN'].head())
print('\n')
print(df['Hospitalized'].head())
In the example above I created two new variables, one human-readable ('Yes'/'No' values) and one boolean. We can use the boolean for aggregate functions.
OUTPUT:
View of the new variables

0     No
1     No
2    Yes
3    Yes
4    Yes
Name: HospitalizedYN, dtype: object


0    False
1    False
2     True
3     True
4     True
Name: Hospitalized, dtype: bool
4. Do any operators have a higher incidence of overall incidents?
'''Create new Dataframe with all the operators.  Operator is needed,
the other column is just to tranform into count column'''

#New DF
operator_incidents = df[['Operator']].copy()

#Create a new column in new dataframe
operator_incidents['Count'] = 1


#Value check for above code (maybe thorough, maybe noob stuff IDK)
print(operator_incidents)
print('\nCheck to make sure sum of count = the # of rows above')
print(operator_incidents['Count'].sum())
Outputs:
             Operator  Count
0      London General      1
1           Metroline      1
2         East London      1
3         East London      1
4           Metroline      1
...               ...    ...
23153     East London      1
23154   London United      1
23155   London United      1
23156   London United      1
23157       Metroline      1

[23158 rows x 2 columns]

Check to make sure sum of count = the # of rows above
23158
Then we use this for the aggregate function:
#Use an aggregate function and the sum of the new 'Count' variable

operator_incidents = operator_incidents.groupby(['Operator'], as_index=False).agg(incident_count = ('Count', 'sum'))

operator_incidents.sort_values(by=['incident_count'], ascending=False)
OUTPUT:
We will finish with tasks 5 and 6 in the next post.
The code for this can be found here on github.
Data Citation:
data.world [@vizwiz]. (2018). 2018/W51: London Bus Safety Performance [Dataset]. https://data.world/makeovermonday/2018w51