Data Analytics Capstone - Summary

Statement of the problem and the hypothesis
Measuring inequality in public schools is not a trivial undertaking. Equality can be simply defined in theory, but in practice, there are many factors to consider. A reasonable goal is to always work to provide equal education to students of all races, genders, sexual orientations, financial backgrounds, and any other societal stratifications where one may find examples of inequality. This study focuses on financial backgrounds. There also exists a multitude of measures to assess equality. One could measure the severity of punishments for one group compared to another, how teachers interact with different groups, the implicit bias found in history lessons for different groups, student educational outcomes of different groups, and numerous other measures for equality. This study will focus on standardized test performance. The research question is “Does the proportion of students who are eligible for free lunch in a school have a statistically significant effect on standardized test scores?”. Free lunch eligibility is used as a measure of household income. The population of students that are eligible for free lunch represents households that are at the federal poverty level multiplied by 1.3 or lower (Department of Agriculture, Food and Nutrition Service, 2015). The hypothesis is that the means of these two groups’ standardized test scores have a statistically significant difference.
This hypothesis will be tested using a two-sample t-test. Regarding this two-sample t-test, we have a null hypothesis that mean test scores for schools with more students eligible for free lunch are not statistically different from schools with fewer students eligible for free lunch with the alternate hypothesis being that mean test scores for schools with more students eligible for free lunch are statistically different from schools with fewer students eligible for free lunch.
Summary of the data-analysis process
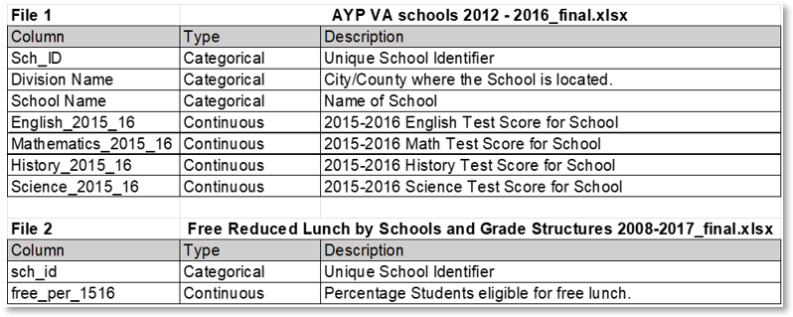
The data comes from a data set containing information about Virginia public schools compiled by University Libraries, Virginia Tech, and Bradburn (2021). The data included the variables of interest, shown in the table below, among many other variables. The most recent year that contained test scores and free lunch information was the 2015 and 2016 school year, so this time frame would be used for the analysis.
Before beginning the analysis, the data was extracted and prepared. The data of interest was put into a Pandas data frame, null values were standardized, data was matched where school IDs were equal, nulls were removed, variables were converted to the proper data types, the test scores were added together into an aggregate field “total_score”, and outliers in “total score” were capped at 1.5 times the interquartile range.
The ”free_per_1516” variable was analyzed to find its median. Schools that had numbers higher than or equal to this median value of 0.37285 were placed into a separate data frame and will be group “1”, the other schools were placed in another data frame and will be group “0”.
With two populations, each with their respective standardized test scores available, we can start looking into whether these groups have statistically different mean test scores. Before beginning the test, a Levine’s test was used to test for equal variance. The result of this is shown below:
#use levene test to check for equality of variance (Bobbit, 2020).
stats.levine(low_percentage_df.total_score, high_percentage_df.total_score, center ='median')
LeveneResult(statistic=54.81184644296979, pvalue=2.0681326644527468e-13)
With this test, we can conclude that each group likely has a different variance in their test respective test scores. A t-test operates with the assumption that both groups have equal variances, yet this is not a critical assumption for a t-test, so the comparison using a two-sample t-test will still be carried out (How to Compare Two Means When the Groups Have Different Standard Deviations. - FAQ 1349 - GraphPad, n.d.). The “scipy.stats” library was used to carry out the t-test and compare the two groups.
Outline of the findings
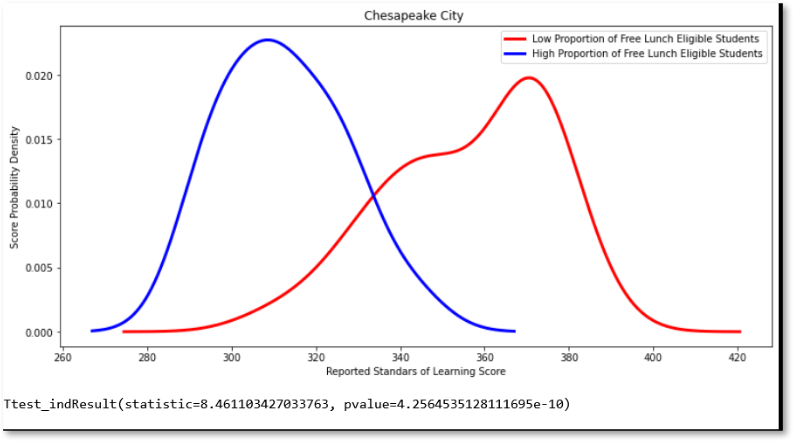
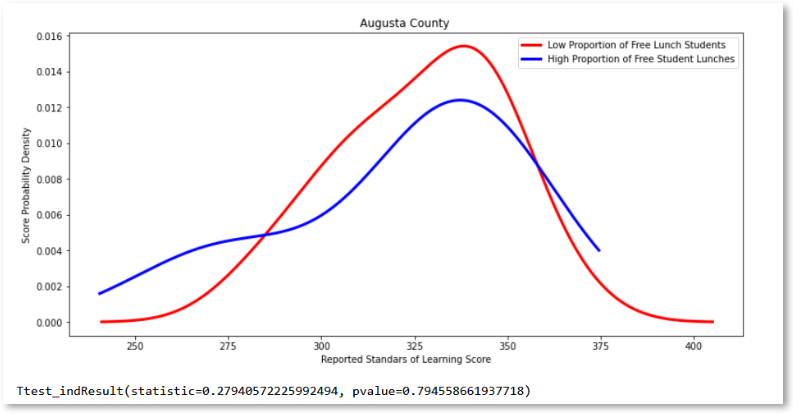
The output of the t-test and a visualization of the probability density of test scores is shown below:
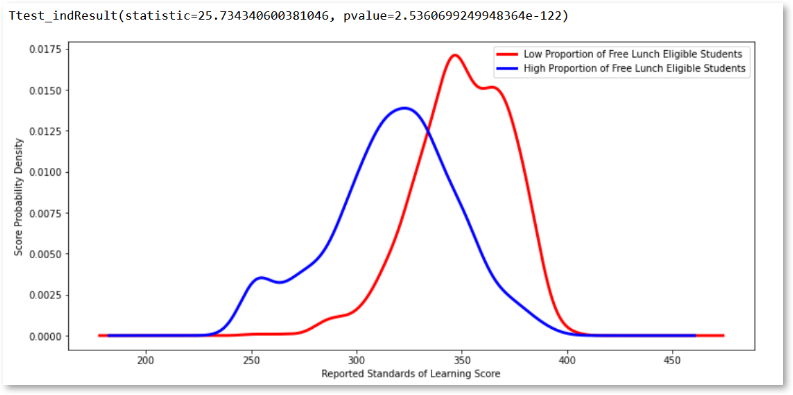
The very low p-value indicates that we can reject the null hypothesis that mean test scores for schools with more students eligible for free lunch are not statistically different from schools with fewer students eligible for free lunch. The probability density plot highlights the performance gap. Schools with a low proportion of free lunch eligible students perform better on standardized tests.
Explanation of the limitations of the techniques and tools used
A two-sample t-test, by definition, compares the means of two groups. This limits our mean comparison to two groups. In this case, above the median, and below the median were chosen to define the school groups, but other groups could be created, perhaps dividing the data into quartiles if needed, and compared using an ANOVA test.
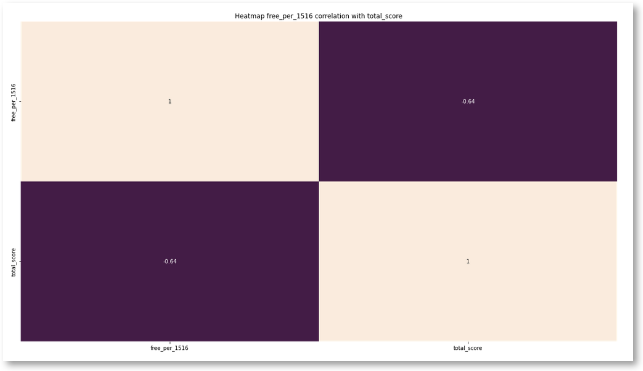
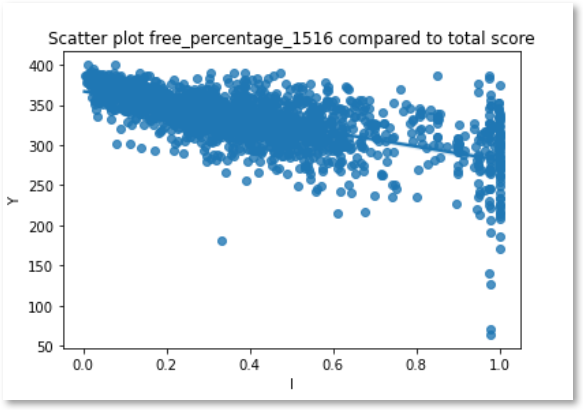
Another limitation is that this t-test does not explore the relationship between increases in a school’s percentage of students who are eligible for free lunch, and the subsequent decrease in standardized test scores. In the data analysis phase of the study, the following heatmap and scatterplot were generated from the data. It appears that there is a correlation, but this is not explored in the t-test.
Summary of proposed actions
Further study on counties that have both types of schools, high median poverty levels, and low median poverty levels is an effective next step. In this subset of counties, one could determine which schools have unequal test scores and which counties have statistically similar test scores for each median poverty grouping. Exploring the differences in these counties may lead to new ideas as to why this inequality exists. It may bring about ideas or policies that can be carried out in counties that have students that are suffering from educational inequalities.
Further research should also be carried out in counties with high levels of inequality to see if there is a systemic housing issue or other mitigating factors that are causing income segregation across schools. The focus of this approach would be analyzing school districts, quantifying the income levels in those districts, and trying to find effective ways to limit the extremes. The extremes here would be schools with very low diversity in student incomes compared to the county’s income diversity levels.
Expected benefits of the study
This study shows that Virginia Public Schools have statistically different test scores based on the proportion of low-income students in a particular school. Knowing that there is a quantifiable problem to solve is a benefit. In 2022, Virginia public schools had a total of 1,296,817 students (Public Education in Virginia, n.d.). Of these students, “Virginia has over 512,000 economically disadvantaged students in its public schools” (Weighing Support for Virginia’s Students, 2021). Increasing fairness and equality in the school system would be a benefit to all students, but certainly to those who are economically disadvantaged. Examining and applying this study at the state level can help decision-makers allocate funds appropriately in support of promoting income equality in schools.
References
Department of Agriculture, Food and Nutrition Service. (2015, March 26).Federal Register: Vol. 80, No. 61. The U.S. Department of Agriculture.https://www.govinfo.gov/content/pkg/FR-2015-03-31/pdf/2015-07358.pdf
How to compare two means when the groups have different standard deviations. - FAQ 1349 - GraphPad. (n.d.). GraphPad by Dotmatics.https://www.graphpad.com/support/faq/how-to-compare-two-means-when-the-groups-have-different-standard-deviations/
Public education in Virginia. (n.d.). Ballotpedia. https://ballotpedia.org/Public_education_in_Virginia
University Libraries, Virginia Tech, & Bradburn, I. (2021, May 18).Characterizing Virginia Public Schools (public dataset). Figshare.https://figshare.com/articles/dataset/Characterizing_Virginia_Public_Schools_public_dataset_/14097092CC license:CC BY 3.0 US
Weighing Support for Virginia’s Students. (2021, April 13). The Commonwealth Institute. https://thecommonwealthinstitute.org/research/weighing-support-for-virginias-students/