Data Analytics Capstone - Full Explanation

Research Question
“We are never going to reach equality in America … until we achieve equality in education.” (The Aspen Institute, 2017). Justice Sotomayor’s words in this interview offer an ugly lesson on the current state of affairs in America, inherently stating that the US does not pass the test to be called equal, and it cannot truly pass that test until education is equal. After growing up in a minority family in a subsidized housing unit, this Supreme Court justice graduated from Princeton summa cum laude, and now is a lifetime member of the nation’s highest court (Wikipedia contributors, 2023). This is one anecdotal example of an exceptional scholar seemingly contradicting her quote. The reason for pursuing the research question is to use data analysis to see past anecdotal examples such as this one. To examine education inequality in the United States, this study asks, “Does the proportion of students who are eligible for free lunch in a school have a statistically significant effect on standardized test scores?”
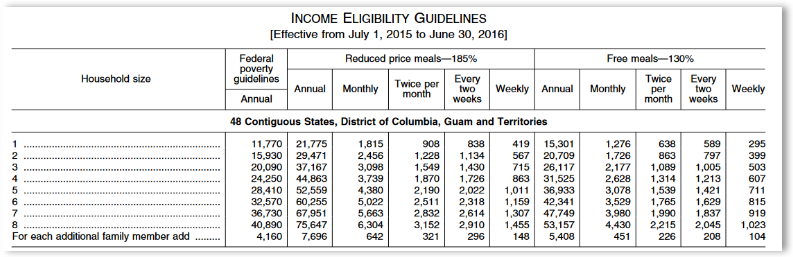
The underlying premise of this question is “are we educating children with differing incomes equally?” The context of this question deals with Virginia Public Schools, specifically in the 2015-2016 school year. The data contains information compiled by University Libraries, Virginia Tech, and Bradburn (2021), and it includes standardized test scores for each school. The study’s focus is on a school’s average performance in standardized tests compared to the school’s proportion of low-income students. The data does not contain the income of student families, but it does contain the proportion of students that are eligible for free lunches. With free lunch eligibility, we can understand family incomes. In the 2015-2016 school year, students that were eligible for free lunches came from households with incomes lower than 130% of the Federal income poverty guidelines as illustrated in the following chart (Department of Agriculture, Food and Nutrition Service, 2015).
It is hypothesized that income levels will have a statistically significant impact on a school’s average test scores. Running a two-sample t-test the null hypothesis is that “mean test scores for schools with more students eligible for free lunch are not statistically different from schools with fewer students eligible for free lunch.” The alternate hypothesis for this comparison test is that “mean test scores for schools with more students eligible for free lunch are statistically different from schools with fewer students eligible for free lunch.”
Data Collection
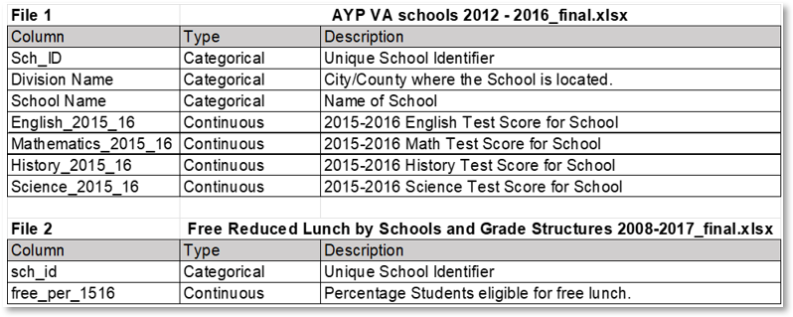
The data will be provided from an existing data set titled “Characterizing Virginia Public Schools (public dataset)” (University Libraries, Virginia Tech & Bradburn, 2021). The data included a series of four Microsoft Excel files with multiple sheets and a text file with a brief description of the data. The data included information from 2008 until 2017. Of the four Excel files, “AYP VA schools 2012 - 2016_final.xlsx” provides relevant data on the “2015-16” sheet. “Free Reduced Lunch by Schools and Grade Structures 2008-2017_final.xlsx” contains relevant information on the “Data” sheet. The following table highlights the variables that are of importance to this study.
Utilizing this data set derived from publicly available information was an advantage because the work of compiling the scores from disparate counties and cities had already been completed. A disadvantage of using this data is that the different Excel files contained different ways of reporting nulls.
The issue of reporting nulls differently in different Excel files was solved by examining the data and the data descriptions. After importing into a Pandas data frame, the nulls would be standardized overcoming this issue. Another issue was making sure time was compared appropriately. To overcome this challenge, the most recent school year that was included in both files was used. This meant including only the “2015-16” sheet from the “Free Reduced Lunch by Schools and Grade Structures 2008-2017_final.xlsx” file and including the columns from the “AYP VA schools 2012 - 2016_final.xlsx” file with the suffix “_2015_16”.
Data Extraction and Preparation
The data preparation steps are outlined in the following list below:
All code is included in a separate file “02_D214_Task_2_Code.ipynb” at this post.
- Save Excel Sheets as CSV using Excel
The data was received in a series of excel files with multiple sheets. The file “AYP VA schools 2012 - 2016_final.xlsx” provides relevant data on the “2015-16” sheet. This sheet was saved as “scores.csv”. “Free Reduced Lunch by Schools and Grade Structures 2008-2017_final.xlsx” contains relevant information on the “Data” sheet. This sheet was saved as “free_lunch_percentages.csv”.
- Import data into a Pandas data frame
The Pandas “read_csv” method was used to import both files into a Jupyter notebook using Python version 3.
#Import data from data set files.

scores = pd.read_csv ('C:\\Users\\will\\Desktop\\Courses\\11 - Capstone - D214\\Task 2\\Data\\scores.csv',
                 index_col=0)

free_lunch_percentages = pd.read_csv \
('C:\\Users\\will\\Desktop\\Courses\\11 - Capstone - D214\\Task 2\\Data\\free_lunch_percentages.csv', index_col=0)- Convert null values to standard ‘nan’
“#NULL!” and “-“ values were changed to “nan”.
#Converting all null value representations to 'nan'
#"free_lunch_percentages" has nulls reported as '#NULL!'.  Changing '#NULL!' to 'nan' with replace() method (Inada, n.d.).
free_lunch_percentages.replace("#NULL!", np.nan, inplace=True)
#"scores" has nulls reported as '#NULL!'.  Changing '-' to 'nan' with replace() method (citation).
scores.replace("-", np.nan, inplace=True)- Create new data frames with only relevant information, then join them on the school ID.
New data frames were created with only the variables that will be used in the study. The “.join()” method was used to match the data on the school ID.
#Only include relevant variables
dependent = scores[["Division Name","School Name","English_2015_16","Mathematics_2015_16","History_2015_16","Science_2015_16"]]
independent = free_lunch_percentages[["free_per_1516"]]
#Join data on both dataframes using join() method (Bobbit, 2021).
df = dependent.join(independent)- Report on nulls, and treat (null removal was used), and repeat the report to confirm the removal.
A function was created to report the numbers and percentages of null information on the data frame. After examining the data it was decided to remove null values with the “dropna()” method.
#Define function to count nulls and output counts/percentage
def nullcounter(dataframename):
    print("\n Your null count for \"{dname}\" is: \n".format(dname=dataframename))
    run = '''nullcounter = pd.DataFrame(({name}.isna().sum()), columns=["Null Count"])
nullcounterpercent = pd.DataFrame(({name}.isna().mean() *100), columns=["Null Count"])
nullcounter['Null %'] = nullcounterpercent
print(nullcounter.loc[(nullcounter['Null Count'] > 0)])'''.format(name=dataframename)
    exec(run)


#Output basic statistics on combined data frame.
print(df.describe())

#Output null count on combined data frame.
nullcounter("df")

#Output null visualization on combined data frame.
msno.matrix(df)
#Drop rows with nulls dependent
df = df.dropna()- Check for duplicates. None found.
The “duplicated()” method was used to examine if there was any duplicate data in the data set. There were no duplicates found.
#Cell 4
#Check for duplicates on all rows

#Check for duplicates
duplicates = df.duplicated()
print("Duplicate data on all rows combined?")
print(duplicates.unique())
print('\n')

#Check for duplicates on index using duplicated() method, sodee snipped from stackoverflow (Matthew, 2013).
df[df.index.duplicated(keep=False)]

print("Data Types")
df.dtypes- Convert variables to appropriate types, remove the “%” symbol, and drop any data that is out of bounds.
The test scores were converted to integers. The percentage of students on free lunch was converted to a float after removing the "%" symbol. Percentage data that was negative or above 1 was deemed out of bounds, and removed using the “drop()” method.
#Convert scores to numeric then integers
df['English_2015_16'] = pd.to_numeric(df['English_2015_16']).astype(int)
df['Mathematics_2015_16'] = pd.to_numeric(df['Mathematics_2015_16']).astype(int)
df['History_2015_16'] = pd.to_numeric(df['History_2015_16']).astype(int)
df['Science_2015_16'] = pd.to_numeric(df['Science_2015_16']).astype(int)


#remove percentage sign and convert to decimal notation using rstrip and astype.  Code snipped from stackoverflow (Bloom, 2014).
df['free_per_1516'] = df['free_per_1516'].str.rstrip('%').astype('float') / 100.0- Create aggregate variable “total_score”.
The scores for each test were added together to create the variable “total_score” using the “sum()” method.
#Create a sum of all test scores as 'total_score'.
df['total_score'] = df[["English_2015_16","Mathematics_2015_16", "History_2015_16", "Science_2015_16"]].sum(axis=1)
df.head()- Cap outliers in "total_score".
Outliers in “total_score” were capped to remain within 1.5 times the interquartile range.
#Capping the data in the skewed distribution "total_score" with 1.5 iqr
#Article mentions treating outliers differently depending on the distribution (Goyal, 2022).

skewed_int_outliers =["total_score"]

#Skewed Distribution Outlier treatment with 1.5iqr
for i in skewed_int_outliers:
    percentile25 = df[i].quantile(0.25)
    percentile75 = df[i].quantile(0.75)
    iqr = percentile75 - percentile25
    upper_limit = percentile75 + 1.5 * iqr
    lower_limit = percentile25 - 1.5 * iqr
    #capping the outliers
    df[i] = np.where(
        df[i]>upper_limit,
        np.rint(math.floor(upper_limit)).astype(int),
        np.where(
            df[i]<lower_limit,
            np.rint(math.ceil(lower_limit)).astype(int),
            df[i]
        )
)- Calculate the median of “free_per_1516” and put schools into two groups based on the median.
The median was used to create two groups of schools. Schools with a percentage of students eligible to receive free lunch greater than or equal to the median were included in group “1”. The remaining schools were placed in group “0”. Two data frames were created based on these different populations.
#Find median and print
free_lunch_percent_median = df['free_per_1516'].describe().loc[['50%']]
print("Median Percent of 'free_per_1516' is: ", free_lunch_percent_median[0], "\n")
#Create distinct gropus of student population based on proportion of students who are eligible for free lunch.
#Values below and above can be replaced based on condition (Komali, 2021).
#Split data into 0.372850 (median of cleaned data set)
df.loc[df['free_per_1516'] >= free_lunch_percent_median[0], 'groups'] = 1
df.loc[df['free_per_1516'] < free_lunch_percent_median[0], 'groups'] = 0
df['groups'] = pd.to_numeric(df['groups']).astype(int)
df.groups.describe()
low_percentage_df = df.loc[df['groups'] == 0]
high_percentage_df = df.loc[df['groups'] == 1]Python was utilized because it is a good language for data science and provides the functionality to deal with data science applications (GeeksforGeeks, 2022). Utilizing a Pandas data frame allowed for all the necessary data transformations on the data. An advantage of using a Jupyter notebook for the data extraction and preparation is the division of tasks into individual cells, this allowed for larger tasks to be decomposed and tested in individual cells. A disadvantage of using Python is that visualization is not a strength, especially when compared to the R programming language (Python Vs. R: What’s the Difference?, 2021). This limitation was overcome by utilizing additional libraries for data visualization in Python.
Analysis
At this point, the data has been placed into two distinct groups. One group in the data frame “low_percentage_df” represents schools that have lower than the median number of students who are eligible for free lunch, and the other group “high_percentage_df” represents schools that have higher than the median number of students who are eligible for free lunch.
To test if these populations have similar test scores, we will compare them using a two-sample t-test. A two-sample t-test “is used when you want to compare two independent groups to see if their means are different” (Glen, 2022). This study will compare the mean test scores of the schools with low proportions of students who are eligible for free lunch and the mean test scores of the schools with high proportions of students who are eligible for free lunch. This use case aligns with the purpose of a t-test.
The analysis steps are described below:
All code is included in a separate file “02_D214_Task_2_Code.ipynb”:
- Visually examine the data:
#Output histogram on free_per_1516
plt.hist(df['free_per_1516'])
plt.title("Histogram {}".format("free_per_1516"))
plt.xlabel("free_per_1516")
plt.ylabel("Count")
plt.show()
#Output histogram on 'total_score'
plt.hist(df['total_score'])
plt.title("Histogram {}".format("total_score"))
plt.xlabel("total_score")
plt.ylabel("Count")
plt.show()
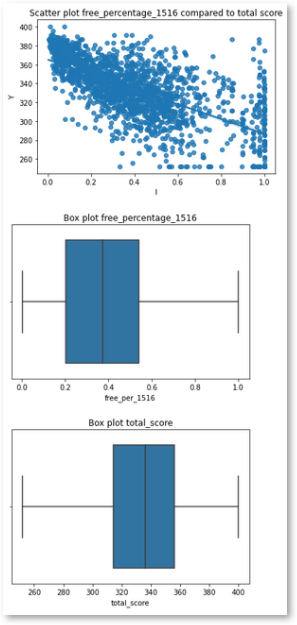
#Output regplot to examine possible relationships
sns.regplot(x = df['free_per_1516'], y = df['total_score'])
plt.title("Scatter plot free_percentage_1516 compared to total score")
plt.xlabel("I")
plt.ylabel("Y")
plt.show()
#Output boxplot to examine data characteristics of 'free_per_1516'
sns.boxplot(df['free_per_1516'])
plt.title("Box plot free_percentage_1516")
plt.show()
#Output boxplot to examine data characteristics of 'total_score'
sns.boxplot(df['total_score'])
plt.title("Box plot total_score")
plt.show()
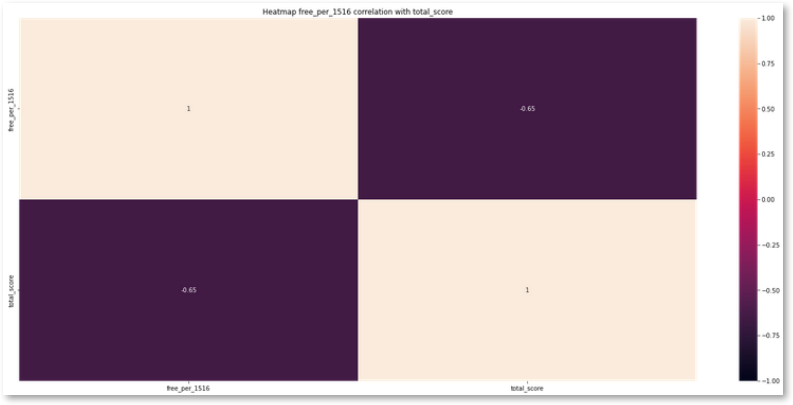
#Output heatmap to examine correlation
plt.figure(figsize=(25, 11))
plt.title("Heatmap free_per_1516 correlation with total_score")
sns.heatmap(df[["free_per_1516","total_score"]].corr(),vmin=-1, vmax=1, annot=True);
#Find median and print
free_lunch_percent_median = df['free_per_1516'].describe().loc[['50%']]
print("Median Percent of 'free_per_1516' is: ", free_lunch_percent_median[0], "\n")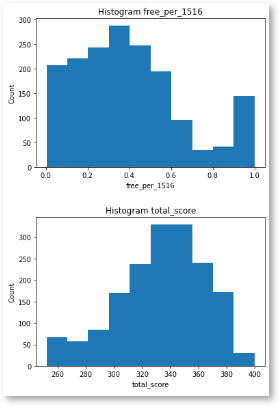
- Test for Equality of variance:
A Levene’s test was used as a preliminary test to check if the two populations had the same variance. The test resulted in a p-value less than .05, meaning we have sufficient evidence to say the variance in test scores between the populations is likely different (Bobbit, 2020).
#use levene test to check for equality of variance (Bobbit, 2020).
stats.levene(low_percentage_df.total_score, high_percentage_df.total_score, center='median')- Perform the two-sample t-test on both populations:
Though the Levene’s test showed that it is unlikely that the populations have the same variance, the t-test was still performed on the data sets. “The t-test is robust to violations of that assumption so long as the sample size isn’t tiny and the sample sizes aren’t far apart” (How to Compare Two Means When the Groups Have Different Standard Deviations. - FAQ 1349 - GraphPad, n.d.).
#Code snippet for t-test derived from website (GeeksforGeeks, 2022).
print(stats.ttest_ind(a=low_percentage_df.total_score, b=high_percentage_df.total_score, equal_var=False))
Output:
Ttest_indResult(statistic=25.734340600381046, pvalue=2.5360699249948364e-122)
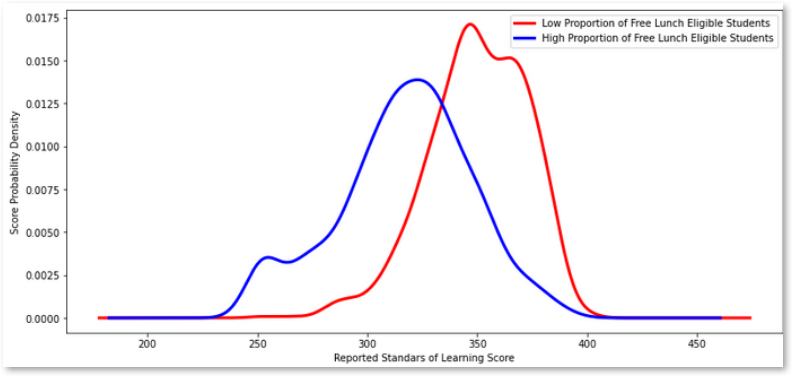
- Visualize population distributions with a Kernel Density Plot.
A density plot was used to further analyze the distribution of test scores in each of the populations.
#Run the t-test
#Code snippet for t-test derived from website (GeeksforGeeks, 2022).
print(stats.ttest_ind(a=low_percentage_df.total_score, b=high_percentage_df.total_score, equal_var=False))

#Plot both population's metrics
low_percentage_df['total_score'].plot(kind='kde', c='red', linewidth=3, figsize=[13,6])
high_percentage_df['total_score'].plot(kind='kde', c='blue', linewidth=3, figsize=[13,6])
# Labels
labels = ['Low Proportion of Free Lunch Eligible Students', 'High Proportion of Free Lunch Eligible Students']
plt.legend(labels)
plt.xlabel('Reported Standars of Learning Score')
plt.ylabel('Score Probability Density')

plt.show()
Output:
An advantage of using the two-sample t-test is its simplicity. After the data is cleaned the test can be performed with one line of code. One disadvantage is that the output is not as rigorous as other tests. A regression model would estimate how much of an increase in the proportion of students receiving free school lunches affected the test scores. The two-sample t-test just reports if the populations likely have different means.
Data Summary and Implications
The two-sample t-test (with a t-value of 25.734340600381046, and a p-value of 2.5360699249948364e-122) shows that there is likely a statistically significant difference between schools with high proportions of students receiving free lunch and schools with low proportions of these students. The probability density graph highlights this difference. Schools with a high proportion of free lunch eligible students are receiving lower standardized test scores.
A limitation of this analysis is that performing tests on the entire state of Virginia’s schools does not consider unique situations. Some of these schools could specifically cater to the needs of those with developmental issues, possibly skewing the results. Perhaps there exist in Virginia schools whose goal is to specifically help those who are economically disadvantaged, possibly leading to schools that have both high achievement on standardized tests, and above median levels of students eligible for free lunch. These are only a few examples of unique situations that may need further consideration.
An immediate action would be to further examine cities with both types of schools. Cities that have both, schools with higher than median amounts of students eligible for free lunch, and schools with lower than median amounts of students eligible for free lunch can be compared. Some of these cities may show a statistically significant difference in test scores in these differing populations. Some of these cities may show that they can effectively teach students from lower-income families equally. If the cities that have more equality in education offer a different approach, different programs, or even have a different pedagogy, these things can be tested in cities that have larger gaps in education equality immediately.
Further examination as to why some schools have large proportions of students eligible for free lunch should also be performed. For example, if school districts are drawn in such a way that unfairly concentrates economically disadvantaged students in some schools while concentrating students with more economic advantages in other schools, the districts should be redrawn to attempt to even out these numbers.
Another aspect to look at when it comes to evening out the incomes in these schools should be housing. The Housing Choice Voucher is a federal program that is meant to assist “very low-income families, the elderly, and the disabled to afford decent, safe, and sanitary housing in the private market.” (Housing Choice Voucher Program Section 8, 2022). Are these cities fully taking advantage of the program? Does the application of the housing program in the city provide low-income families opportunities to live in districts that have lower levels of poverty, or does the voucher program need to make improvements in this area? Asking these questions, and course correcting when schools have uneven levels of student income is a necessary step.
Further study of the data set would be to look closely at individual counties and cities to see where income inequality exists, specifically where it is influencing student outcomes. This can be done by performing the same two-sample t-test with a city/county scope as opposed to a statewide scope. Another approach would be to attempt a regression to examine how much of an influence the proportion of students that are eligible for free lunches affects test scores.
Income inequality is just one measure of inequality in schools. It is important to continue to pursue studies about inequality to quantify the effects, understand the influences, and importantly to try to fix the issues. No form of separate and unequal education in schools should be accepted. When these discrepancies are discovered, it is important that everything is done to understand the issue and as quickly as possible correct the problem.
References:
Bobbit, Z. (2020, July 10). How to Perform Levene’s Test in Python. Statology. https://www.statology.org/levenes-test-python/
GeeksforGeeks. (2022, November 17).Python for Data Science.https://www.geeksforgeeks.org/python-for-data-science/
Glen, S. (2022, January 12). Two-Sample T-Test: When to Use it. Statistics How To.https://www.statisticshowto.com/two-sample-t-test-difference-means/
Housing Choice Voucher Program Section 8. (2022, January 11). HUD.gov / U.S. Department of Housing And Urban Development (HUD). https://www.hud.gov/topics/housing_choice_voucher_program_section_8
How to compare two means when the groups have different standard deviations. - FAQ 1349 - GraphPad. (n.d.). GraphPad by Dotmatics.https://www.graphpad.com/support/faq/how-to-compare-two-means-when-the-groups-have-different-standard-deviations/
Python vs. R: What’s the Difference? (2021, March 23). IBM. https://www.ibm.com/cloud/blog/python-vs-r
The Aspen Institute. (2017, March 30). In Conversation: Justice Sonia Sotomayor and Abigail Golden-Vazquez [Video]. YouTube.https://www.youtube.com/watch?v=EaJuyXqGF2E&feature=youtu.be
University Libraries, Virginia Tech, & Bradburn, I. (2021, May 18).Characterizing Virginia Public Schools (public dataset). Figshare.https://figshare.com/articles/dataset/Characterizing_Virginia_Public_Schools_public_dataset_/14097092CC license:CC BY 3.0 US
Wikipedia contributors. (2023, February 3). Sonia Sotomayor. Wikipedia.https://en.wikipedia.org/wiki/Sonia_Sotomayor
Department of Agriculture, Food and Nutrition Service. (2015, March 26).Federal Register: Vol. 80, No. 61. The U.S. Department of Agriculture.https://www.govinfo.gov/content/pkg/FR-2015-03-31/pdf/2015-07358.pdf
Code References:
Bloom, G., [GaryMBloom]. (2014, September 4). Convert percent string to float in pandas read_csv. Stack Overflow. https://stackoverflow.com/questions/25669588/convert-percent-string-to-float-in-pandas-read-csv
Bobbit, Z. (2020, July 10). How to Perform Levene’s Test in Python. Statology. https://www.statology.org/levenes-test-python/
Bobbit, Z. (2021, November 6). How to Merge Two Pandas DataFrames on Index. Statology. https://www.statology.org/pandas-merge-on-index/
Chattar, P. (2021, September 2). Find common elements in two lists in python. Java2Blog. https://java2blog.com/find-common-elements-in-two-lists-python/
GeeksforGeeks. (2022, October 17). How to Conduct a Two Sample T Test in Python. https://www.geeksforgeeks.org/how-to-conduct-a-two-sample-t-test-in-python/
Goyal, C. (2022, August 25). Feature Engineering – How to Detect and Remove Outliers (with Python Code). Analytics Vidhya. https://www.analyticsvidhya.com/blog/2021/05/feature-engineering-how-to-detect-and-remove-outliers-with-python-code/
Hadzhiev, B. (n.d.). Remove common elements from two Lists in Python | bobbyhadz. Blog - Bobby Hadz. https://bobbyhadz.com/blog/python-remove-common-elements-from-two-lists
Harikrishnan, R., [Harikrishnan R]. (2020, January 26). Dropping rows with values outside of boundaries. Stack Overflow. https://stackoverflow.com/questions/59914605/dropping-rows-with-values-outside-of-boundaries
How to compare two means when the groups have different standard deviations. - FAQ 1349 - GraphPad. (n.d.). GraphPad by Dotmatics. https://www.graphpad.com/support/faq/how-to-compare-two-means-when-the-groups-have-different-standard-deviations/
Inada, I. (Ed.). (n.d.). Replacing values with NaNs in Pandas DataFrame. https://www.skytowner.com/explore/replacing_values_with_nans_in_pandas_dataframe
Komali. (2021, December 27). Pandas Replace Values based on Condition. Spark by {Examples}. https://sparkbyexamples.com/pandas/pandas-replace-values-based-on-condition/
Matthew. (2013, November 25). Pandas: Get duplicated indexes. Stack Overflow. https://stackoverflow.com/questions/20199129/pandas-get-duplicated-indexes